Charles Hooper

Thoughts and projects from an infrastructure engineer

Problems at Scale

Over on HackerNews, saturn wrote that:

Cloud computing scales the efficiencies, yes. It also scales the problems.

This is exactly right. Problems in simple architectures are relatively easy to solve. In fact, I’d go as far as to say that we’ve probably solved them in all of the traditional archetypes, both in theory and in practice.

On the other hand, complex architectures lead to exponentially more difficult problems. There are probably lots of problems in these various complex architectures that we don’t even know exist yet. And then there are those problems that we do know about that we think will only occur in very rare (or even “impossible”) circumstances so they get considerably less attention devoted to them.

Those of us who have careers, jobs, and hobbies in an engineering discipline need to remember this when we make decisions about the design of a new or existing system. Just because we can’t see the underlying platform, because it’s been abstracted away from us, doesn’t mean that it doesn’t exist. For example, much of the recent AWS downtime was contributed to by design flaws in the Elastic Block Store system. If you think you should be hosted on the cloud, use it, but take the time to understand the systems under the hood.

Amazon’s Relational Database Service (RDS) – the Black Box From Hell

One morning I woke up early and checked my email. My plan was to check that my inbox was empty for some peace of mind and then go back to bed for a few more hours (I love Sundays). But that isn’t what happened. Instead, upon opening my inbox I was alerted that one of a client’s database servers was offline. I snapped out of my haze and immediately got to work.

This particular database server was a RDS instance. RDS, or Relational Database Service, is an Amazon-provided MySQL (or Oracle) server that runs on top of the EC2 platform. The advantages to this service are that backups are performed automatically (complete with point-in-time recovery,) snapshots are supported, the instances can be resized with more or less RAM/CPU/storage through the AWS console, and a whole bunch of other stuff (“maintenance”) is supposed to be performed for you automatically.

The disadvantages don’t make themselves apparent until you need to debug or troubleshoot a performance or availability issue. While CloudWatch metrics are included as part of the RDS package, knowing how much CPU, RAM, or storage space you’re using is only a very small part of knowing what your database instance is actually doing.

Prior to attempting recovery, the first thing I did was to check the CloudWatch metrics. CloudWatch seems to have trouble reporting its data when the system is under durress because there were periods where there was data and there were periods where there wasn’t. The next thing I did was check the RDS event logs. Don’t get excited, the RDS event log is not a UI wrapped around system logs, it’s just a couple of entries here and there on what Amazon RDS decides to publish. The last entry in the event log was a backup job that started several hours before and never finished. These typically only take one to two minutes to finish on this instance so I knew something was wrong.

I didn’t want to waste time trying to troubleshoot while the database was down so I instead moved immediately to recovery and rebooted the instance through the AWS console. It’s like Charles McPhail says, “Respond, Restore, Resolve.” After about a whole 20 to 30 minutes the database server began accepting connections again but the instance was never taken out of the “REBOOTING” state when it should have transitioned to “STARTED”. With the instance in the “REBOOTING” state, my only option now was to recover from a previous backup as the rest of the functionality is disabled unless the instance is in a “STARTED” state.

To make matters worse, the various components in our infrastructure were connecting to this database server and were making it impossible to find out what’s going on. The max connection limit was reached and I was no longer able to login and view the process list or analyze the status variables.

At this point, I decided my only course of action was to spin up a new instance from a previous backup. I made this request through the AWS console and, two to three hours later, my new instance was finally up and running. About a half an hour prior to this, the old instance was transitioned into a “FAILED” state and shut down. When your instance is in the “FAILED” state, you cannot restart it. Your only option is to restore from backup. In my case, it took several hours for AWS to declare the instance as failed and it took several hours to restore the backup. I did not know that the “FAILED” state was even a possible state and had no idea that AWS could just kill an instance like that. To top it all off, Amazon sent a very nice email to the owner of the account (my client the CEO) explaining that we’ve been using an unsupported storage engine all this time.

As it turns out, I missed the note in the RDS User Guide that says that MyISAM is not supported, particularly when it comes to data recovery. While I understand why RDS made this decision (MyISAM gets corrupted easily and is not easy to repair sometimes,) I felt misled and uninformed about the support of the storage engines. Yes, the note is in the RDS User Guide, however, it is not mentioned anywhere in the main page about RDS nor is it in the RDS FAQs (where the string “MyISAM” only appears once).

A few weeks have gone by and we have taken steps to avoid and reduce the damage from these types of outages in the future. However, we still occasionally receive an alert where an RDS instance stops accepting connections for one to two minutes at a time and all the event log has to say is that the instance has been “recovered.” Recovered from what exactly? What did you do to it? Why does this keep happening? How do we make it stop?

In summary, I’ll probably never know because on RDS you do not have access to the underlying OS. This means:

  • You do not have access to the OS process list
  • You do not have access to things like top, htop, iostat, or dstat
  • You do not have access to the process list if the MySQL process isn’t accepting connections
  • You do not have access to any system logs

If you just need a quick and dirty MySQL server and you almost never want to worry about the status of your backups, go ahead and use RDS. However, if you’re concerned about reliability (that you control,) being able to effectively troubleshoot problems, and knowing the state of your underlying OS, RDS is not right for you.

A Couple of Python Snippets

I haven’t updated in awhile but I decided to drop a couple of gists in here and call it a post. These snippets are incredibly simple and I don’t expect to “wow” anybody here, but I was asked for them recently and am posting them here.

Group words by their first letter in Python

group_by_letter.pylink
1
2
3
4
5
6
7
8
9
10
11
12
13
14
15
16
17
18
19
#!/usr/bin/env python

"""Group words by their first letter"""

from collections import defaultdict

def group_by_letter(words):
    buckets = defaultdict(lambda:[])
    for word in words:
        buckets[word[0].lower()].append(word)
    return buckets

if __name__ == '__main__':
    print group_by_letter(['narragansett','brooklyn lager','magic
hat','dog fish head','shock top','ten penny','bass'])
    # Output: defaultdict(<function <lambda> at 0x7fc83416b2a8>, {'b':
    # ['bass', 'brooklyn lager'], 'd': ['dog fish head'], 'm': ['magic
    # hat'], 'n':['narragansett'], 's': ['shock top'], 't': ['ten
    # penny']})

Merging list of lists in Python using reduce

merge_lists.pylink
1
2
3
4
5
6
7
8
9
10
11
#!/usr/bin/env python

"""Merging list of lists in Python using reduce()"""

def merge_lists(list_of_lists):
    return reduce(lambda x,y: x+y, list_of_lists)

if __name__ == '__main__':
    my_big_list = [ [1,2,3], [3,4,5], [6,7,8], ]
    print merge_lists(my_big_list)
    # output: [1, 2, 3, 3, 4, 5, 6, 7, 8]

Common Single Point of Failure: People

Yesterday, when I arrived at my other job on my school’s help desk, I found out that my supervisor was not coming into work at all. This is OK; I enjoy the autonomy of working unsupervised. However, at this particular university’s help desk, my supervisor is the only person who can reset security profile information on student accounts. She is also the only person who assigns work orders to the technicians that work here. I’ll spare you the details, but probably 80-90% of our workload on any given day gets passed through this one person.

This is a serious problem. By passing tasks through a single person with no backup we are guaranteeing the collapse of our support system. I’ve seen this at other gigs and I bet you have, too.

Maybe it’s the one person who has access to the firewall or router. Or maybe there’s that only person who knows how to configure a particular piece of software or solve a specific problem. Truthfully, you’re probably that person and don’t even realize it. Ever get work-related phone calls (or worse: called in) during your “time off?” Red flag.

All of these conditions are single points of failures (SPoF). Too often, we sysadmins, developers, and engineers only think of SPoFs in terms of hardware and software. But if we look at what actually makes up the entire information system (hardware, software, data, procedures, and people), we see that we’re part of it too. This hoarding of knowledge often results in a failure of the system itself and very frequently makes existing failures worse.

Example

A customer-facing database server stops responding. You’re not really familiar with what database(s) it serves but customers are complaining that it’s down or very slow. There’s another person that normally handles this system but they’re out of town and completely unreachable. You want to diagnose but you don’t even know how to access the system. Do you blindly reboot (risking data loss and corruption)? Sit and wait it out? Learn how to summon your co-worker’s spirit?

One very real situation occurred when I worked at a small Internet Service Provider. A very big client of ours called and said that a very large portion of their network was down (we managed it, too). Did I have the credentials to the router in question? No. Did the client? No. Who did? That one person did, the one who is usually too busy running around to return calls (incidentally, the owner). They did finally return our cries for help… 3 hours later. Was the problem difficult to solve? No. In fact, it was fixed within minutes of receiving the proper credentials. (Funny story, one of their on-staff techs plugged a network camera into the network and accidentally assigned their router’s address as the camera’s IP :)) Sure, this mistake was dumb, but did this client need to suffer degraded availability for these 3 hours? Absolutely not.

Solution

The obvious, and perhaps only, solution to this problem is to make as much of your knowledge available as possible. The more knowledge you offload from your brain, the better and more efficient the system becomes. I know to some this might seem a little counter-productive. After all, having this knowledge is job security…right?

No, absolutely not. Holding company knowledge hostage should never be how you ensure your job security (that’s a myth anyways).

With that being said, please don’t spend all your energy and effort on documentation only to abandon the effort a month later. I was speaking to a friend of mine earlier when he mentioned that very often he comes across company Wikis all the time that usually contain outdated information and haven’t even been logged into in 6 months.

Allow me to re-iterate, do* not* go on documentation sprees. Document everything when you do it and share that information *when *you do it. Regularly. Constantly. If you wait until you have alot of information to document, then you will probably become overwhelmed and just not do it. When I was in the Air Force, we had a saying:

The job ain’t over till the paperwork is done.

Simply put, add documentation into your regular workflow. The investment is small and the returns are great.

Controlling Django Apps With an Init Script

If you’re reading this, you probably already know that an init script is a specific style of script that allows you to control daemon processes. In particular, they are used to start processes at boot and terminate them at shutdown. What follows is an example script I use to control one of my Django FastCGI projects. This particular example was written for Ubuntu and Debian but could probably be modified for RedHat/CentOS or other distros.

Please refer to your Distro’s documentation on how to install and activate init scripts (hint: See /etc/init.d/ and the man page for update-rc.d if on Debian or Ubuntu.)

django-fcgi-init.shlink
1
2
3
4
5
6
7
8
9
10
11
12
13
14
15
16
17
18
19
20
21
22
23
24
25
26
27
28
29
30
31
32
33
34
35
36
37
38
39
40
41
42
43
44
45
46
47
48
49
50
51
52
53
54
55
56
57
58
59
60
61
62
63
64
65
#!/bin/sh

PATH=/sbin:/bin:/usr/sbin:/usr/bin

FCGIHOST="127.0.0.1"
FCGIPORT="5000"
RUNAS="projectuser:projectgroup"
UMASK="200"
DAEMON="/path/to/django/manage.py"
NAME="MyProject"
DESC="My Django Project"
RUNDIR=/var/run/$NAME
PIDFILE=/var/run/$NAME/$NAME.pid
ENV="env -i LANG=C PATH=/usr/local/bin:/usr/bin:/bin"
SSD="/sbin/start-stop-daemon"

DAEMON_OPTS="runfcgi host=$FCGIHOST port=$FCGIPORT pidfile=$PIDFILE
daemonize=true"

test -x $DAEMON || exit 0

set -e

. /lib/lsb/init-functions

# Set up /var/run directory to write out pidfile
mkdir -p "$RUNDIR"
chown "$RUNAS" "$RUNDIR"
chmod 775 "$RUNDIR"

case "$1" in
 start)
 log_daemon_msg "Starting $DESC" $NAME
 if ! start-stop-daemon --start --quiet --oknodo \
 --pidfile $PIDFILE --umask "$UMASK" --chuid "$RUNAS" \
 --exec $DAEMON -- $DAEMON_OPTS
 then
 log_end_msg 1
 else
 chmod 400 $PIDFILE
 log_end_msg 0
 fi
 ;;
 stop)
 log_daemon_msg "Stopping $DESC" $NAME
 if [ -f $PIDFILE ]; then
 kill `cat -- $PIDFILE`
 rm -f -- $PIDFILE
 log_end_msg 0
 fi
 ;;
 restart|force-reload)
 $0 stop
 $0 start
 ;;
 status)
 status_of_proc -p "$PIDFILE" "$DAEMON" "$NAME" && exit 0 || exit $?
 ;;
 *)
 echo "Usage: $0 {start|stop|restart|force-reload|status}" >&2
 exit 1
 ;;
esac

exit 0

Automating Webcam Snapshots and Uploads to Flickr

With gardening season right around the corner, one of my desires was to set something up that would allow me to take automated, regular snapshots of some of my plants and upload them to flickr. After a few cumulative hours I finally cobbled together the solution.

Taking the Snapshots

The first thing I needed to do was to take snapshots from an installed USB webcam and save them to a directory. This needed to be able to run from a cron script so obviously it needed to work without a GUI and without user-interaction. I read in a Webcam Howto that I could do this using streamer so I installed it and wrote a short shell script that would iterate through the video devices installed on my PC and run the snapshot command. You can view the source of this script here.

Uploading the Photos

Next I wanted to automatically upload the files to Flickr. At first, I tried using a script I found called uploadr.py which worked OK, but I also wanted to add my photos to a specific set which this script didn’t do. I probably could have extended its functionality, but this script didn’t use or implement the full Flickr API which made this task seem unnecessary.

Instead, I downloaded the Python Flickr API from Stuvel and in less than 90 lines I had working code to upload a directory of images to Flickr and add them to a given set. You can view the source to my flickr uploader script here, which I’m calling simpleuploadr.py for now.

Results

Here are my pretty pictures :) My apologies for the quality, I’m using a really cheap webcam.

Correlating Last Login Dates With Signup Dates From a MMORPG

Yesterday, I wrote a blog post detailing how I crawled an entire MMORPG’s player database via their search page. Since then, I have been analyzing that data in Minitab and trying to gain some insight into the state of affairs of that game. Today, I’m going to attempt to explain some of that data using statistics and common sense. In particular, we’re going to find out if there’s a relationship between when players join the game *and *when they stop returning.

Preparation

I’m new to the statistics software package I’m using, Minitab, and I’m not aware of an easy way to take measurements based on dates. So, my first order of business was to convert dates in the database to an easier metric for analysis, “days since today,” which is simply today’s date minus date x. I did this in my database (MongoDB) prior to export by adding a “last_seen_days” attribute to all documents (records). This attribute is simply the difference between today’s date and the date that the player stopped logging in – measured in days. I then did the same for the signup date. This was quickly done in the MongoDB console in just a few lines:

> var today = new Date();
> var day = 60*60*24*1000;
> db.accounts.find().forEach(function (o) { o.last_seen_days = Math.ceil((today.getTime() - o.last_seen.getTime())/day); db.accounts.save(o); })
> db.accounts.find().forEach(function (o) { o.date_joined_days = Math.ceil((today.getTime() - o.date_joined.getTime())/day); db.accounts.save(o); })

The Scatterplot

I then exported my data to CSV, loaded it in Minitab, and created a scatterplot between these two attributes. What I got was this:
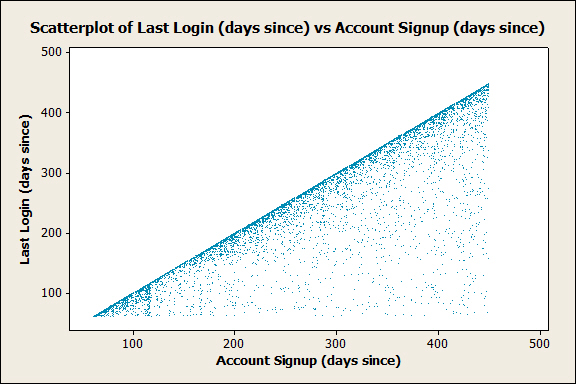
Last Seen Date vs Signup Date

For the uninitiated, a scatterplot **is a quick and easy way to visually see if there’s any type of relationship (correlation) between two variables. In this case, I used the signup date as my **independent variable (x) and the “last seen” date as my dependent variable (y). Overall, there is not *any real relationship between the signup date and the last seen date. However,* there are two significant items in this graph that deserve to have some attention brought to them.

Observations

The first and most obvious item is that there are not any points above the identity function. The identity function, or just f(x) = x, is the diagonal line directly across the center of the graph. This makes perfect sense since it’s impossible for a player to have their “last login” occur before they even sign up. I bring this up because this leads into my next observation:

There is a heavier concentration of data points plotted on or directly below the line of the identity function. For points exactly on the identity function, these are accounts that registered but were never logged into. For accounts *below *the identity function, these should be considered more significant to those who run the game. Why is that? Because, simply put, I believe that these accounts belong to players who went through the effort of joining; They signed up, validated their email address, logged in, and for whatever reason chose not to stick around. This is akin to the “bounce rate” so frequently mentioned in the context of web analytics.

It’s possible that these new players didn’t  understand the interface and left, or maybe they thought the game play was too slow, or maybe… this list could go on. What’s important is that some attention is paid here. Some effort should be made to discover why these players are leaving and the number of these players (or almost-players) should be measured, monitored, and analyzed. Decreasing this metric (“bounce rate”) should be a regular goal as these players represent a potential revenue stream for the game’s owner as well as a potential contribution to the game for the rest of the players.

The Histogram

While, in this case, the scatterplot helped us see that there are a noticeable amount of players who quickly “bounce” after joining the game, this type of graph doesn’t make it particularly easy to measure the magnitude of this phenomena. From observing this behavior, we next want to know how many players are leaving, or what our “bounce rate” is. Instead of first trying to quantitatively define the bounce rate so that we can measure it, it’s probably best if we first take a look at the total distribution of how long players are active for before leaving. For this, we’ll use the histogram of “Days Active”. Days active is simply days since signup minus days since last login.Here’s what we’ve got:

In this histogram, I excluded the lowest rank from being included in the histogram. I did this because I was more interested in how many potentially-active players were leaving, as opposed to junk accounts. As such, our definition of the bounce rate is already becoming more different than the bounce rate in web analytics.

Each bin (“bar”) in our histogram is 15 days wide. Knowing this, you can see from the histogram that the largest density of days active seems to be about from 15 days to 2.5 months. This chunk, while significant, doesn’t have much to do with our bounce rate mentioned above. What we’re instead interested in is the near-5% of players who become inactive in less than a week.

What’s Next?

If this were my game (it’s not), I would work on defining what level of bounce rate is acceptable and set some goals based on that. I would then look into the large amount of players leaving within the first 2.5 months and try to increase player retention. Finally, I would automate these measurements and have them displaced in a nice administrative dashboard (I’ve always wanted one of those) so that I have to see them all the time.

Screen-Scraping Search Results for Information Retrieval

Recently I found myself in a situation where I needed to gather a large amount of data from a website but there did not exist any API, index, or otherwise publicly-accessible map of the data. In fact, the only mechanism for uncovering data to be collected was a very limited search engine.

In particular, I was trying to collect a list of (living, non-banned) usernames from a web-based RPG I play so I could then download, parse, and store their profiles for further analysis. I needed all of the data simply because there also was not any way in which I could get a truly random statistical sample.

The game’s search engine has these limitations and features:

  • Search is performed on username only and implicitly places a wildcard after the search. For example, if you search for “bob” not only will “bob” be returned in the results, but also “bob123″ and “bobafett,”
  • If a given search returns more than 35 results than only the first 35 results are returned,
  • Results are sorted by username (alphabetically),
  • Usernames are case-insensitive and can only contain alphanumeric characters, i.e. {ABCDEFGHIJKLMNOPQRSTUVWXYZ1234567890},
  • Search queries cannot start with the character zero (“0″), but I happily overlook this,
  • The search engine does allow you to filter out players who have been killed or banned.

So, there I was, trying to crawl this game’s search feature using urllib and regular expressions. I first tried to search for “A”, then “B”, then ”C”, and so on, but there were some obvious flaws with this method. In particular, because of the limit on the number of results that can be returned, this method would only yield 1,260 usernames. This isn’t good enough because I knew from the game’s statistics page that I should be expecting a little more than 21,000 names!

The logical extension of that search method is to tack on an extra letter. For example, try “AA”, then, “AB”, then “AC”, all the way down to “ZZ” (or, erm, “99″ on this case). This seems alot better because, hypothetically, the keyspace is large enough to return more than twice as many usernames than what I need – I believe the math is (36^2)*35 or 45,360 usernames.

Unfortunately, this  method falls apart very quickly because there isn’t an even distribution of usernames across the keyspace. I could try to go one level deeper on the searches (e.g., “AAA” to “AAB”, and so forth) but now we’re looking at 36^3 or 46,656 search pages I have to crawl, so this method is out of the question.

Making matters worse, I am completely naive as to what the distribution of usernames might actually look like.I know what it looks like now, but moving forward I had absolutely no idea what to expect. (Just in case you’re curious, you can see the actual distribution – sans accounts that start with “0″ – below.)

Account Distribution by First Character

I decided, then, that I would start with “A” to “Z” to “1″ to “9″ and dynamically and recursively expand one level deeper if only 35 results were returned from the search. You can see this dynamic, search unfolding code here on Bitbucket (Python, lines 46 through 65).

The results were pretty positive. I crawled almost the entire set of alive, unbanned accounts in just over 2 hours (while I played video games and drank beer). I missed exactly 356 accounts, or about 1.6% of the population. While some of these may have been accounts that started with the character “0″ (remember, I couldn’t crawl those,) it seems more likely that many of these were aborted HTTP requests that failed and were handled by my ridiculous try/except:pass block.

Now that I have this data, it’s time for me to do something with it. You’ll hear more about that from me soon, I’m sure.

Multiple Vulnerabilities in Mingle Forum (WordPress Plugin)

Title: Multiple Vulnerabilities in Mingle Forum (WordPress Plugin)
Advisory URL: http://www.charleshooper.net/blog/multiple-vulnerabilities-in-mingle-forum-wordpress-plugin/
Date Published: January 8th, 2011
Vendors Contacted: Paul Carter – Maintainer of plugin.

  1. Summary

Mingle Forum is a plugin for the popular blog tool and publishing
platform, WordPress. According to the author of Mingle Forum, “Mingle
Forum has been modified to be lightweight, solid, secure, quick to
setup, and easy to use.”

There exist multiple vulnerabilities in Mingle Forum, SQL injection
being among them.

  1. Vulnerability Information

Packages/Versions Affected: Confirmed on 1.0.24 and 1.0.26

3a. Type: SQL Injection [CWE-89]
3a. Impact: Read application data.
3a. Discussion: There is a SQL injection vulnerability present in the
RSS feed generator. By crafting specific URLs an attacker can retrieve
information from the MySQL database.

3b. Type: SQL Injection [CWE-89]
3b. Impact: Read application data.
3b. Discussion: There is a SQL injection vulnerability present in the
`edit post` functionality. By crafting specific URLs an attacker can
retrieve information from the MySQL database.

3c. Type: Auth Bypass via Direct Request [CWE-425]
3c. Impact: AuthZ is not performed for `edit post` functionality.
3c. Discussion: By browsing directly to the `edit post` page a user can
view and edit any page.

  1. PoC & Technical Description

4a.
http://path.to/wordpress/wp-content/plugins/mingle-forum/feed.php?topic=0 UNION SELECT 1,user_email,3,4,5,user_login,7 FROM wp_users #

4b.

4c.

  1. Report Timeline

12/17/2010 Initial email sent to plugin maintainer.
12/22/2010 Confirmation of first email requested.
12/31/2010 Correct email address obtained. Maintainer contacted again on
this date.
01/01/2011 Received response from plugin maintainer.
01/07/2011 Plugin maintainer releases update that addresses these
vulnerabilities.

  1. References

6a. The WordPress Plugin page for Mingle Forum:

  1. Legalese

This vulnerability report by Charles Hooper < > is
licensed under a Creative Commons Attribution-NonCommercial-ShareAlike
3.0 Unported License.

  1. Signature

Public Key: Obtainable via pool.sks-keyservers.net

Picking Applications to Audit

I’m sure almost any programmer will tell you that at some point they felt the need to work on a project but had no idea what to work on. This happens to me, too, even when it comes down to choosing what applications or services I want to audit. With practice, I’ve come up with a pretty good list of categories to choose software from and I would like to share them with you.

1. Applications or Service You Use

This is probably to most obvious way to choose what application or service to audit. However, to me, it’s also one of the hardest. The reason why it is so difficult is because it involves breaking out of your mental “user” mode where you’re just using the application or service. I know that when *I’m *in “user” mode, I probably am not even fully conscious of the amount of software or services I use every day and how much I rely on them.

The solution, then, is to break out of “user” mode. Once out of “user” mode (and in “audit” or “attack” mode) everything becomes clearer. For example, I recently submitted a vulnerability to a pretty large service provider (I can’t say who yet); was the vulnerability in some back page or a piece of functionality that nobody uses? No, surprisingly, this vulnerability was part of a key piece of functionality that I actually use frequently.

2. Applications or Services That You “Like” or “Believe In”

This is more of an extension than the item above, but it’s worth stressing. If there’s an application or service that you think has potential, go ahead and audit it. New applications and services are often full of low-hanging fruit. By auditing these and reporting the vulnerabilities, you are helping to make these applications and services better.

3. Applications and Services That Make It “Economically Beneficial” to Audit Them

This is a no-brainer. If you’re being offered money to audit an application or service (and the person offering the money has the authority to give you permission to do so,) then this is a pretty good place to start. Google, for example, has a Vulnerability Rewards Program.

Closing

These are just three of the categories to look for applications or services to audit. It’s certainly not complete as there is a plethora of software out there waiting to be audited, but I hope that this gives you a good head start.